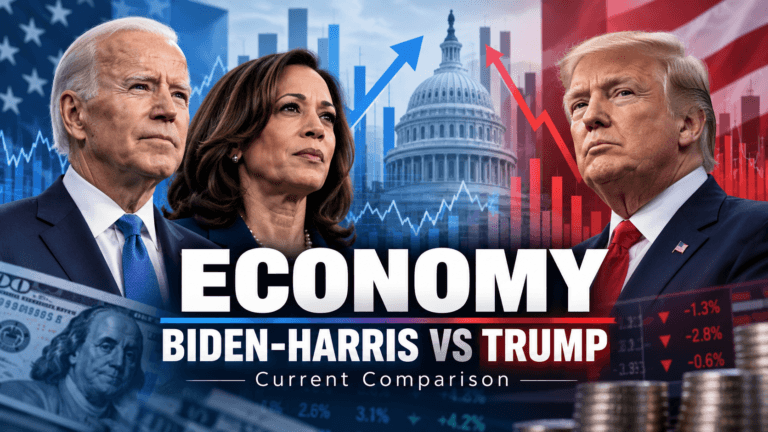
U.S. Fiscal & Economy Tracker

Official federal debt, deficit, budget, inflation, and unemployment data—explained in plain English. Actual results, current estimates, and projections are clearly identified so you can see what the numbers really mean.

TREASURY • CBO • OMB • BLS

U.S. Fiscal & Economy Tracker

Actual results are labeled as actual. Current CBO figures are labeled estimates. Full-year CBO figures and older OMB budget figures are labeled projections or historical estimates so they are not mistaken for completed results.
Debt checks every 30 min
Debt since the presidential term began
MetricStart of termCurrentChange
Total National DebtThe total amount the federal government owes.$36.207T$40.069T+$3.862T
Plain English: Total National Debt is now $40.07 trillion, $3.86 trillion higher than the start-of-term baseline.
Debt Held by the PublicTreasury debt held outside federal government accounts.$28.846T$32.363T+$3.517T
Plain English: Debt Held by the Public is now $32.36 trillion, $3.52 trillion higher than the start-of-term baseline.
Intragovernmental HoldingsTreasury securities held by federal government accounts and trust funds.$7.361T$7.706T+$345.1B
Plain English: Intragovernmental Holdings is now $7.71 trillion, $345.1 billion higher than the start-of-term baseline.
Federal budget: actuals, current estimates, and projections
Fiscal periodReceiptsOutlaysDeficitStatus
FY2025Mar. 11, 2024$5.485T$7.266T$1.781THISTORICAL OMB ESTIMATE
Plain English: This is what OMB projected for FY2025 before the year was completed. It is kept only so readers can compare the old projection with the final result. Source
FY2025FY ended Sep. 30, 2025$5.235T$7.010T$1.775TACTUAL — COMPLETED YEAR
Plain English: FY2025 is complete. The government collected about $5.235 trillion, spent about $7.010 trillion, and borrowed about $1.775 trillion to cover the shortfall. Source
FY2026Mar. 11, 2024$5.873T$7.419T$1.547THISTORICAL OMB ESTIMATE
Plain English: This was an older OMB projection for FY2026. It is not the current estimate. It is shown to demonstrate how expectations changed. Source
FY2026 through Aug. 2026Sep. 9, 2026$4.845T$6.812T$1.967TCBO CURRENT ESTIMATE — 11 MONTHS
Plain English: This is CBO’s near-current estimate for the first 11 months of FY2026, based on Treasury information. It is not yet the final full-year result. The unadjusted deficit was $6 billion smaller than the same period in FY2025; after correcting for payment timing, CBO says it was about $82 billion larger. Source
FY2026 full yearAug. 10, 2026 update≈ $5.4T≈ $7.4T≈ $2.1TCBO FULL-YEAR PROJECTION
Plain English: CBO’s latest full-year projection is about a $2.1 trillion deficit. CBO said revenues were expected to be about $200 billion below its February baseline while outlays remained close to that baseline, so the receipts and outlays shown here are approximate context, not revised exact totals. Source
What changed from the old OMB projection?
FY2025: OMB projected a $1.781T deficit; the final Treasury result was $1.775T — about $6B smaller than projected.
FY2026: the old OMB projection was a $1.547T deficit; CBO’s latest full-year projection is about $2.1T — roughly $553B larger than that older projection.
Jobs and inflation
MetricBaselineCurrentChange
Unemployment RateBLS, seasonally adjusted4.1%4.1%No meaningful change
Plain English: About 4.1 out of every 100 people in the labor force are unemployed and actively looking for work.
Inflation Rate — CPI-U, 12-month changeBLS Consumer Price Index2.9%3.4%+0.5 pts
Plain English: Consumer prices were 3.4% higher than 12 months earlier. A $100 basket a year earlier would cost about $103.40 at that inflation rate.
Debt vs. deficit: Deficit is how much more the federal government spends than it collects during a defined period. Debt is the total amount the federal government owes after years of borrowing.
Actual vs. estimate: Actual means the fiscal year is completed and Treasury has reported the result. CBO current estimate is the best near-current year-to-date estimate. Projection estimates where the unfinished fiscal year may end. Historical OMB estimate shows what OMB predicted in an older budget.
Debt baseline: Jan. 17, 2025 • Current debt: Sep. 24, 2026
BLS baseline: Dec. 2024 • Current unemployment: Aug. 2026 • Current CPI: Aug. 2026

Project 2025: Mandate for Leadership

The Heritage Foundation’s Mandate for Leadership outlines proposed changes to federal agencies, executive power, staffing, regulation, education, immigration, energy policy, and other areas of government.

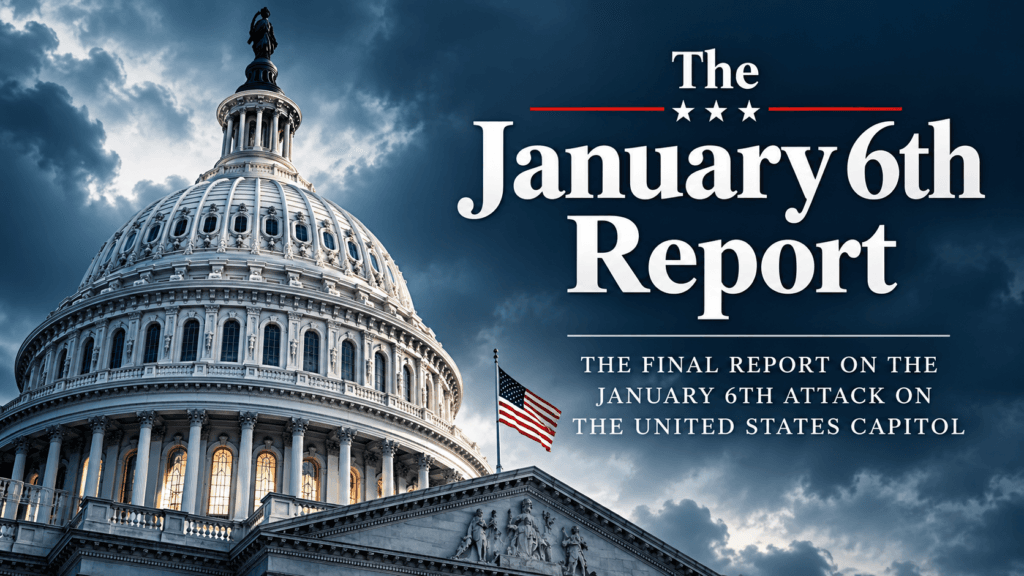
The January 6th Report

The House Select Committee’s final report presents the findings of its investigation into the January 6, 2021 attack on the U.S. Capitol and provides access to the committee’s supporting materials. The official report was released December 22, 2022.

The Mueller Report

Special Counsel Robert S. Mueller III’s report documents the investigation into Russian interference in the 2016 presidential election and related matters. The DOJ archive identifies the report as Report on the Investigation into Russian Interference in the 2016 Presidential Election.


Featured Political Video

Watch the full audio coverage of Donald Trump’s hush money sentencing hearing.

Scroll to Top